
If your small business invests in digital marketing, how do you determine how well it’s paying off? This is an important question because if you’re not tracking your marketing dollars to ensure you’re seeing a respectable ROI, you could be throwing money out the window. Digital marketing metrics provide the quantifiable proof you need that your marketing is working and helping meet your goals.
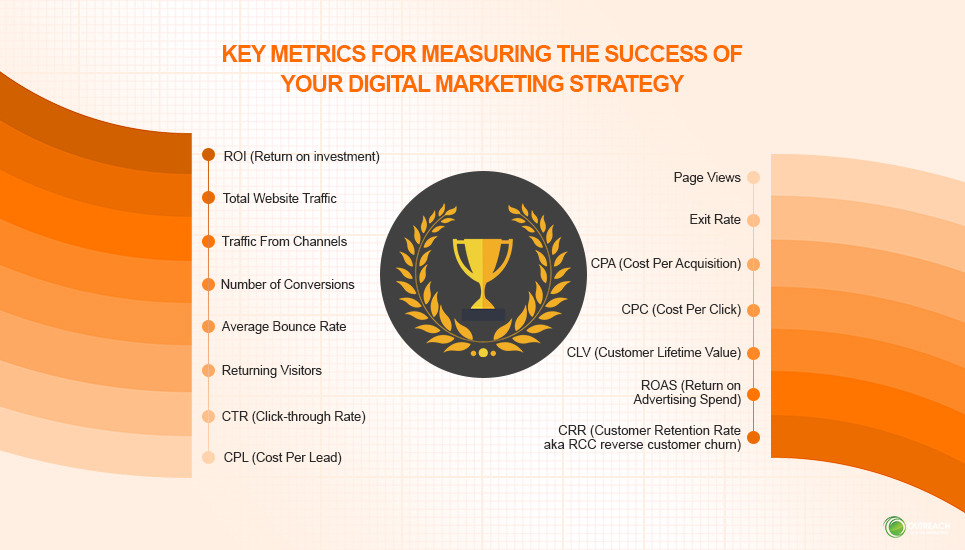
Here we share the key metrics for measuring the success of your digital marketing strategy, so every penny spent leads to pennies earned.
ROI (Return on investment)
This is all you need to understand how well each marketing tactic delivers on the dollar so you focus on the highest-performing aspects of your marketing strategy and see the best results.
You calculate your ROI based on the following (Sales Growth – Organic Sales Growth – Marketing Cost) / Marketing Cost = Marketing ROI
You want at least $5 for every $1 spent to turn a profit.
Total Website Traffic

Increasing website traffic helps people discover your brand and products, making total website traffic important. Obviously, it measures how many visitors your website receives, including new and return traffic. With total website traffic you understand if you’re successfully strengthening your online presence and the effectiveness of your digital marketing campaigns. Measuring week over week allows you to track progress.
You should hope to see at least 50% and need to make improvements on anything 30% or less.
Traffic From Channels
Along with website traffic, you need insights on those visitors, from the top drivers to what CTAs work best. This is vital information as it identifies the tactics you need to focus your marketing spend. If a tactic isn’t working, you can either experiment with different CTAs, ads, posts, etc. or decide to invest more in top performers.
In other words, knowing where traffic comes from allows you to zero in on the top-performing channels or understand what creative and messaging works best based on the following:
- Direct visitors who have either visited you before or are familiar with your brand.
- Organic traffic driven by search engines.
- Referred visitors from links to your site on other sites such as a news article, mentions on social posts, shares, etc.
- Email visitors from your email campaigns, newsletters, personalized email messages, etc.
- Social media such as Facebook, Instagram, Twitter, or LinkedIn.
- Paid visitors from ads such as pay-per-click (PPC) advertising, display advertising, or social media ads.
The higher the visitors, the better your ads and the more likely it is your audience is using these channels. But you also need to consider conversions…
Number of Conversions
Conversions tell you how well your marketing delivers on your objectives, whether it is sales, subscriptions, brand engagement, etc. So, you can track both paid and unpaid transactions resulting from your efforts. This is crucial because although you can measure site traffic, if visitors do nothing more than click the link without taking further steps or completing your call to action, you aren’t meeting your goals. You can create a benchmark number to measure performance against.
Calculate conversions based on the following: Number of conversions divided by number of total ad interactions x 100
The conversion average considered very respectable is between 2% and 5%.
Average Bounce Rate
Bounces refer to visitors leaving your site without acting, such as clicking a CTA button, clicking on navigation, or following through on something, such as completing a form or making a purchase. You also can see how engaging your web pages are based on how long your visitors spend on each page. The longer a visitor spends on a page, the more engaging they find it, and the better it is for SEO as well as conversion potential.
You can calculate your average bounce rate based on the total number of page visits divided by the total number of entries to your website.
The number to aim for varies quite a bit between 26% to 70% with the average for a B2C website of 45% and 56% for B2B.
Returning Visitors
Your returning visitors tell you a bit about your customer journey as well as how engaging your site is. If someone visits and bounces, never to be seen again, your website fails to provide the content they needed to complete their goals. The more returning visitors you have, the more likely it is they find your content useful. With this metric, you can determine how well your content is performing by measuring a certain period, results from a campaign, or other goals. From there, you can create a strategy to help improve your numbers, assisting people along the legs of their journey and helping nurture relationships with trusted expertise and engaging content.
Anything over 30% is good.
CTR (Click-through Rate)
Your CTR measures the relevance and effectiveness of your paid ads based on the number of clicks. If you fail to get clicks, you are failing to create compelling ads that resonate with your audience.
You calculate your CTR based on (the number of clicks/number of impressions) x 100
Impressions refer to how many people see your ad, while the click is the physical act of clicking the link. A good CTR is between 2% to 5%.
CPL (Cost Per Lead)
This metric measures the profitability of your marketing, allowing you to use data to allocate money towards your campaigns. This optimizes your spend.
You calculate CPL based on expenses attributable to marketing campaigns divided by the number of leads = CPL
To ensure you’re not eating into your profits, you want your CPL to be at least $20 for an average of $100 spend.
Page Views
As the name implies, this measures how many visitors view your pages. This is specific to a single session and works best when you consider it along with time spent on the page or your website. Your content is working when people spend more time on your site seeking further information and digging deeper. At the same time if visitors are bouncing from page to page in minutes or seconds, your content is failing to answer questions. This results in a wild goose chase with visitors trying to find helpful content.
However, page views also tell you what website pages are the most popular and engaging, such as:
- E-commerce: Page views are a straightforward way to see what products are popular, what products lead to conversions, and what products fail to secure a sale.
- Blogs: Which content engages visitors most often and with the lowest bounce rates?
- Landing pages: Which landing pages keep people on the site longest and see the most conversions?
A good page view rate would be at least 1.8 upwards of 4.4.
Exit Rate
Exit rate is different from bounce rate as it measures how many users leave your site pages, not how long they visit them. This tells you where your conversion strategy is failing. If you see a high exit rate on your landing pages, they aren’t delivering on what visitors expect based on the source they are clicking.
You want an exit rate between 20% to 30%
CPA (Cost Per Acquisition)
Your goal is to reduce your CPA as much as possible. CPA tells you how much it costs to convert a customer. So, the higher the CPA, the more your marketing costs eat into your profits. You can also use CPA to set a target.
A good CPA is about 3:1.
CPC (Cost Per Click)
CPC refers to the cost of clicks for your digital ads, again providing a key metric to show how cost-effective your ads are – or aren’t. The cost will vary based on your bids for keywords, which is an excellent way to determine the best focus keywords. You might be tempted to use higher cost keywords based on their popularity when, in fact, they cost you more than they benefit you. With high CPCs you see less ROI in most cases. Tracking CPC ensures you can reduce your CPC and increase your ROI and your ROAS (return on advertising spend defined below).
This is harder to target for measuring against what is considered a good CPC rate as it is determined by your ROI on the spend. For example, you want at least $1.20 back if you spend a $1.
CLV (Customer Lifetime Value)
This is the number that tells you how much customers spend over their life as your customer. It is a metric you can use for predictions based on historical data that tells you what revenue your customers are contributing compared to how much it costs you to keep that customer loyal to your brand.
To calculate the average, multiply customer value by your average customer lifespan
This number should be at least three times greater than your Customer Acquisition Cost (CAC).
ROAS (Return on Advertising Spend)
You can measure how effectively your campaigns perform based on dollars to determine which ad campaigns generate enough revenue to more than cover your ad spend.
You can calculate your ROAS by dividing your revenue from your ad campaigns by the costs.
This is another tricky one to benchmark, but a common ROAS is $4 revenue to $1 spend.
CRR (Customer Retention Rate aka RCC reverse customer churn)
CRR tracks how many customers return to your company for purchases. As the saying goes, it costs more to find new customers than it does to retain existing customers. By maximizing your CRR, you should be able to reduce your marketing costs significantly.
This calculation is a bit more complex:
- Select a period to measure
- Use the number of customers at the end of the period
- Subtract the number of new customers gained in that period
- Divide that number by the number of customers at the beginning of the period
- Multiply that number by 100 to get your percentage
The higher this number, the better. Decreases tell you something is amiss, so you need to determine why customers aren’t returning. In other words, why are you seeing increased customer churn?

You should investigate your industry average for this, but an overall average would be 35% to 84%. A bit broad, for sure.
Using quantitative metrics provides clarity that shows you the true value of your digital marketing campaign, accurately measuring your investment, progress, and performance to make smarter strategic decisions.
Ready to measure your success? Consult with our experts to identify and track key metrics for your small business.